One of the biggest struggles of running Facebook Ads is trying to read the data you pay so much to “collect” and make the best ad management decisions.
Sure, you can stick with the stock out-of-the-box column views that come with your Facebook Ads manager.
The only problem with that is you never get a complete picture of how your ads are performing across the entire funnel.
You’re stuck with basic metrics that don’t really tell you where the problems are and what you should focus on.
In this post I’m going to:
- Give you the exact metrics I look at to manage $100k+/mo in ad spend across multiple accounts and in the order I set them up in a custom column preset.
- Why I do it this way, and why you should too.
Let’s get started…

Here’s the Facebook Ads manager column preset I use to manage thousands of dollars in ad spend every day, without losing my mind.
Delivery
CPM
Impressions
3-second video plays
Video Plays at 95%
Video average play time
Unique CTR(all)
Unique CTR(link click)
Unique link clicks
Unique content views
Unique adds to cart
Unique checkouts initiated
Purchases
Cost per unique link click
Cost per unique content view
Cost per unique add to cart
Cost per unique checkout initiated
Cost per purchase
Budget
Amount spent
Purchases conversion value
Purchase ROAS
Frequency
Relevance diagnostics metrics
It may seem like a lot, but there’s a method to the madness. Let me explain…
Delivery
This is so you can quickly see whether your campaign is on or off or if there are any issues that need solving. Pretty straight forward.
CPM
This is a loose indication metric of how much competition there is in the audiences you’re targeting and how well your ads are resonating. CPM stands for cost per mille. It’s the amount you pay the platform per one thousand visitors who see your ads.
I try to shoot for around $10 for this metric. I like less best, but $15 may be acceptable if the overall campaign is profitable. If you’re over $20 here you should take a look at “relevance diagnostics” at the ad level to see where you may be able to improve.
Impressions to 3-second video plays.
I use these numbers to keep a pulse on how well my video ads are stopping people in their scrolls. The higher you can get your 3-second video plays per impression ratio the better!
To improve 3-second video plays you can do 2 things:
- Test new hooks in the first 3-5 seconds of your video ads.
- Test your ads with more targeted audiences.
3-second video plays
Video Plays at 95%
Video average play time
These are the metrics I look at to asses how engaging my video ad is overall. I may be getting a good 3-second video play number, which means I’m getting attention, but then my video plays at 95% could drop off, which means my video is boring.
You want to work towards getting your video plays at 95% as close as possible to your 3-second video plays. To improve Video plays at 95% and average playtime create better video ads.
Unique CTR(all)
Unique CTR(link click)
These are the metrics I look at to see how exciting my ad copy and messaging is. The unique CTR(all) is a more general metric that tracks how “clicky” the ad is overall. What I really pay attention to in the unique CTR(link click). This metric is the metric that tells you how your ad is performing at sending traffic to your offer.
Work to keep your Unique CTR(link click) above 1% at all times. the higher you can get this metric the better your ad and offer are resonating with your audiences. Shoot for 3-5% or more.
Unique link clicks
Unique content views
The relationship between these two metrics can tell you a lot about your website experience especially if your ads are sending traffic directly to a page that should fire the pixel as view content (i.e. Shopify product page).
When you’re sending traffic directly to your product pages you want these two metrics to be as close as possible and if you have 100 link click but only 50 view contents you probably have a slow loading website. People will not wait longer than 6 seconds for your website to load, a lot of people won’t wait longer than 3 seconds.
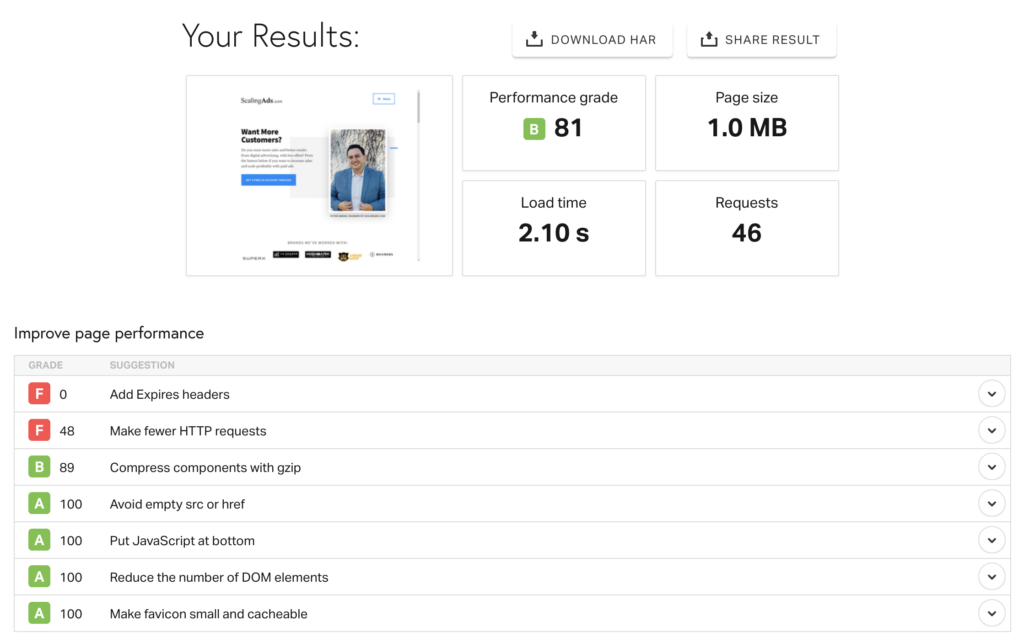
To test your site speed you can use Pingdom Website Speed Test here. They will give you a grade and things to focus on to improve your performance.

Unique content views
Unique adds to cart
Unique checkouts initiated
Purchases
These are the 4 metrics to use to identify where in your sales funnel you might have “leaks”. If you’re seeing that you have a bottleneck in add to carts, meaning lots of people add it to their cart but not many buy, it could mean that something is happening in the checkout experience that is causing too much friction.
Keep an eye on the numbers here because they are an indication of how well your customer experience is converting the traffic you are sending.
Cost per unique link click
Cost per unique content view
Cost per unique add to cart
Cost per unique checkout initiated
Cost per purchase
These are the metrics I use to see how my ads and campaigns are performing against each other. You should know your breakeven metrics for the products you are advertising.
The most important breakeven metric I look at in this stack is Cost Per Purchase. Cost per purchase (CPP) is a metric that I know will play into my ROAS (return on ad spend) and profit margins. The CPP is the main metric you can influence on the ads side to improve your overall ROAS.
Budget
Amount spent
These metrics are just to keep track of where my campaign budget is set and how much the campaign, ad sets, and ads have spent.
Purchases conversion value
Purchase ROAS
This is how much money you’re making and how “profitable” that money is. ROAS is the metric people look at when they talk about “putting one dollar in and getting 2 dollars out”. The 2 dollars out means that they have a 2 overall ROAS.
The ROAS you need to hit and above depends on your average cost of goods and your average order value.
And easy way to find your break-even ROAS (which means you don’t lose or make any money) is this formula: 1/Gross Margin
For example: If your gross margin is 60% on your product. Then your breakeven ROAS will be 1/.60 = 1.67. Now you know as long as your ads are above 1.67 ROAS you are making a profit on the acquisition of new customers.
Keep in mind that this is a business, and the most expensive thing to do is acquire customers. Once you have the customer it cost much less to get them to buy again.
Frequency
Relevance diagnostics metrics
I look at Frequency in my retargeting campaigns. I try to keep daily frequency below 3. But this also depends on your sales cycle. If it takes longer for your customers to make a buying decision (if your average order is above $100 maybe) you have be still seeing profitable results around a 5 frequency. But for most people, it’s good to stick to below 3 frequency.
Frequency is how many times the same people see the same ads.
Here are a few things you can do to lower the frequency:
- Lower the daily spend budget.
- Create and introduce new ads to those audiences.
- Bring in fresh people to the retargeting audiences from your interest and lookalike (COLD) campaigns.
Hope this helps!
Comment below, what metrics do you look at when managing your Facebook ad campaigns? 👇
